
Home » O2C Intelligence Platform » O2C Execution Layer » O2C Apps » Analytics
Accounts Receivable Analytics Across the Order-to-Cash Cycle
Sidetrade’s Analytics app is accounts receivable analytics built into the Order-to-Cash platform, delivering structured, role-based reporting and self-service data exploration across the full cycle.
Real-time dashboards, unified datasets, and flexible visualizations give finance and operations teams the visibility and insight needed to make faster, more confident decisions.
Analytics Solves Your Challenges
Siloed, inconsistent reporting
O2C metrics pulled from multiple systems and calculated differently across teams – reconciliation is slow and performance figures are unreliable.
Centralized Datasets and Unified Metrics consolidates data into a single, consistent source of truth.
Dependency on IT for business insight
Every new or modified report requires BI or IT resources. This slows decision-making and limits agility when issues emerge.
Self-Service, Customized Report Creation lets teams build and explore reports independently.
Reactive management due to limited visibility
Without real-time dashboards and alerts, backlog spikes, and overdue risks and workload imbalances are identified too late.
Key Threshold Reporting Notifications alerts teams to performance changes as they happen.


Features
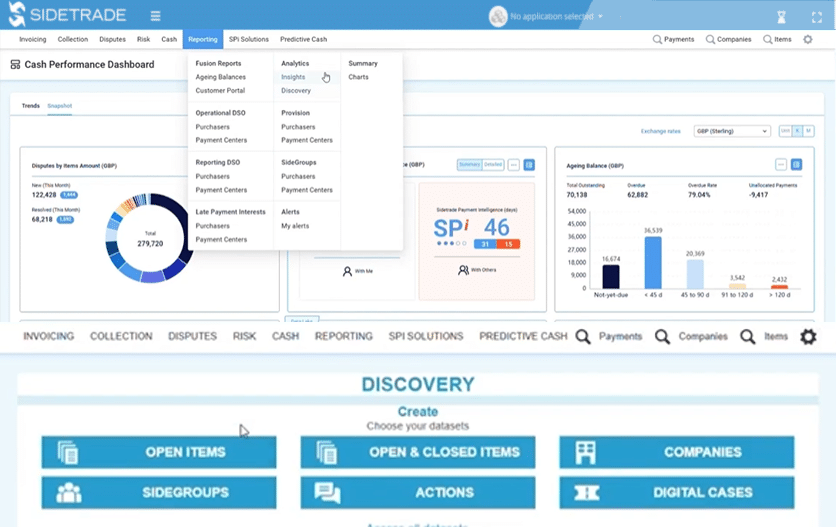
Analytics combines pre-built reporting with self-service exploration across the full Order-to-Cash cycle.

Curated Reporting and Performance Monitoring
Pre-built dashboards give real-time visibility into key O2C metrics with no setup required.

Self-Service, Customized Report Creation
Business users define views, filters, and dashboards without coding, so new reports do not need BI or IT resources.

Centralized Datasets and Unified Metrics
Data from multiple systems is consolidated into a single, unified dataset with consistent metric definitions.

Business-Friendly Data Definitions
Reporting uses business terminology rather than technical system labels, so teams across finance and operations interpret the same metric the same way.

Custom Data Integration
CSV file import extends reporting to additional data sources without requiring BI reimplementation.

Deep Dive and Data Exploration
Drill down from high-level KPIs to transaction-level detail to identify root causes.

Key Threshold Reporting Notifications
Threshold-based alerts notify teams of performance changes as they happen.

Why Sidetrade?
Analytics is natively embedded within Sidetrade to deliver consistent and governed insight across every O2C application
How Analytics Fits Your Order-to-Cash Process
Analytics is natively embedded within Sidetrade to deliver consistent and governed insight across every O2C application, consolidating debt and dispute information into a single global view.
That includes disputes and claims routed by invoice dispute management, payments matched by cash application automation, decisions made in credit risk management software, activity worked through collections automation, and buyer self-service in the accounts receivable customer portal.

Frequently Asked Questions
What is accounts receivable analytics?
Accounts receivable analytics is the reporting and analysis finance teams use to track receivables performance: DSO, CEI, aging balances, dispute rates, collection effectiveness, and payment behavior. Sidetrade Analytics covers these across the full Order-to-Cash cycle, using real-time data from connected systems rather than a separate BI tool.
Does Sidetrade Analytics require a separate BI tool or data extraction?
Sidetrade Analytics operates as part of the native O2C platform and does not require a separate BI tool or manual data extraction. It delivers embedded analytics directly within workflows, using real-time data from connected systems.
Can non-technical users build their own reports in Sidetrade Analytics?
Sidetrade enables non-technical users to create and customize reports through an intuitive, user-friendly interface. Business users define views, filters, and dashboards without coding, accelerating access to actionable insights.
How does Sidetrade Analytics handle data from multiple systems?
Analytics consolidates O2C data from connected systems into a single, unified dataset with consistent metric definitions, so figures reconcile across teams. Debt and dispute information is brought into one global view without separate extraction or manual reconciliation.
Does Sidetrade Analytics support custom data integration?
Sidetrade supports custom data integration through its flexible connector framework and API-driven architecture. Organizations incorporate additional data sources to enrich analytics and align with specific business requirements.
What O2C metrics and KPIs can be tracked in Sidetrade Analytics?
Sidetrade Analytics tracks a comprehensive set of O2C metrics and KPIs, including DSO, CEI, aging balances, dispute rates, cash flow forecasts, collection effectiveness, and payment behavior insights. It provides real-time visibility and benchmarking to drive continuous performance improvement.

Ready to Transform Your Order-to-Cash?
Finance transformation with AI is at your fingertips. Are you ready? Join finance leaders already experiencing the power of Aimie. Take the first step towards transforming your order-to-cash operations.